


Next: About this document ...
Up: JPO_freakwave_html
Previous: Evaluation of the singular
No References!
List of Figure Captions
- Figure 1
- Comparison of wave height distribution from laboratory data and
theory (
 : laboratory data, solid line:
Eq.(
: laboratory data, solid line:
Eq.(![[*]](crossref.png) ), dashed line: (), dotted line:
Rayleigh distribution).
), dashed line: (), dotted line:
Rayleigh distribution).
(a)

(b)
- Figure 2
- Occurrence probability of freak wave as a function of number of waves
 and kurtosis
  .
.
- Figure 3
- Ratio of freak wave occurrence predicted by
Eq.() to the Rayleigh theory.
- Figure 4
- Relationship between
 and .
and .
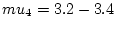
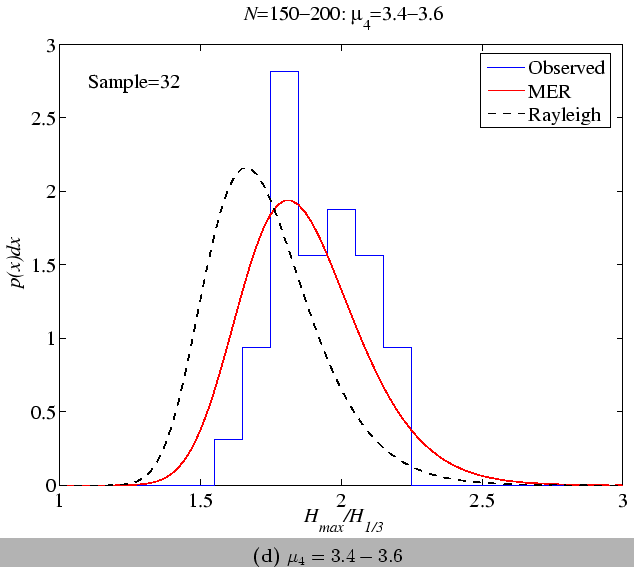
- Figure 5
- Comparison of the maximum wave height distribution with
observed data and theory (
 ).
).
- Figure 6
- Dependence of
 on and .
(a) Observed data
(b) Theory
- Figure 7
- Dependence of occurrence probability of freak wave on
and .
(a) Observed data
(b) Theory
Figure:
Occurrence probability of freak wave as a function of number of waves and kurtosis .
|
Figure:
Ratio of freak wave occurrence predicted by
Eq.() to the Rayleigh theory.
|
|
Figure:
Observed relationship between
and in
field.
|
Figure:
Comparison of the maximum wave height distribution with
observed data and theory ().
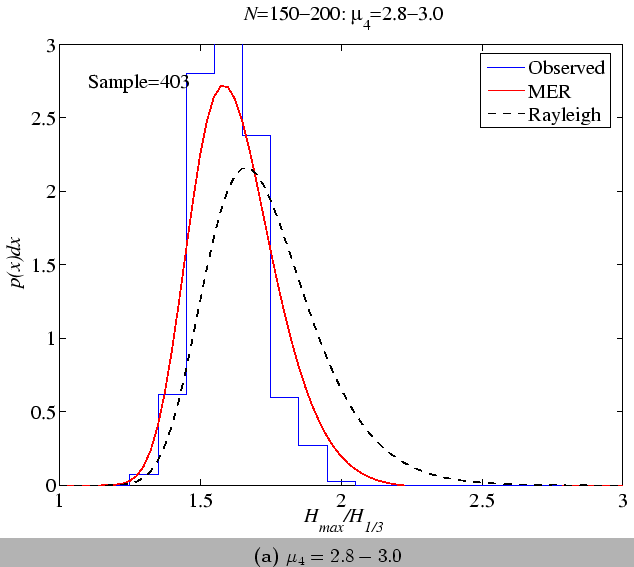 |
Figure:
Comparison of the maximum wave height distribution with
observed data and theory ().
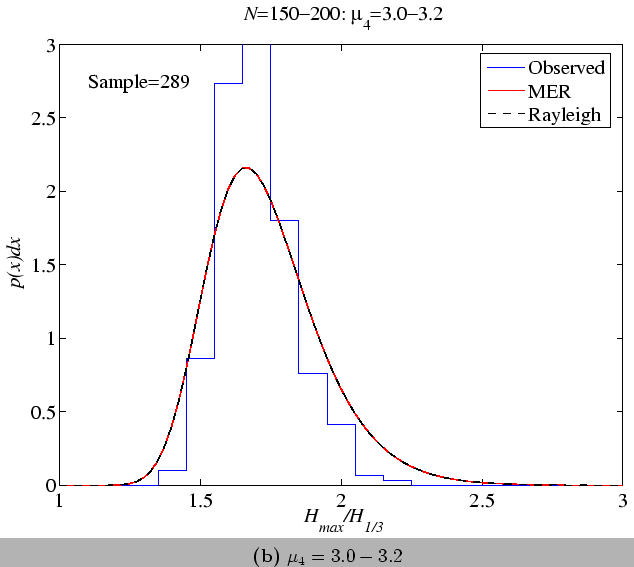 |
Figure:
Comparison of the maximum wave height distribution with
observed data and theory ().
 |
Figure:
Comparison of the maximum wave height distribution with
observed data and theory ().
 |
Next: About this document ...
Up: JPO_freakwave_html
Previous: Evaluation of the singular
2006-08-21
![\includegraphics[width=14 cm]{figures/ERdist_case1}](img200.png)
![\includegraphics[width=14 cm]{figures/ERdist_case2}](img201.png)
![\includegraphics[width=14 cm]{figures/P_freak}](img202.png)
![\includegraphics[width=14 cm]{figures/R_freak}](img203.png)
![\includegraphics[width=14 cm]{figures/observed_1}](img204.png)
![\includegraphics[width=14 cm]{figures/observed_HmHs}](img209.png)
![\includegraphics[width=14 cm]{figures/theory_HmHs}](img210.png)
![\includegraphics[width=14 cm]{figures/observed_Pf}](img211.png)
![\includegraphics[width=14 cm]{figures/theory_Pf}](img212.png)